New Management Tools – Key Performance Indicators
The main feature of the KPI dashboard is the Key Performance Indicators (KPIs). These KPIs are there to provide the user with real time data at a glance. If a user wants to quickly view the figures from a period of time they can look at one of their 15* selectable KPIs.
From the list of 15* KPIs the garage will be able to choose any combination to display. A total of 6 KPIs can be displayed simultaneously. These 6 can then also be ordered into the garage’s preference.
*There are 15 KPIs currently available but later versions will have more options.

KPI Tile
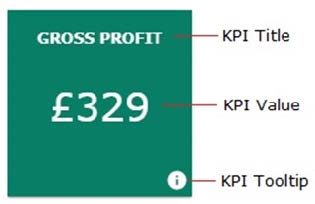
Each KPI Tile will be made up as follows:

KPI Title – Easy to distinguish title section, identifying which KPI is being shown
KPI Value – Largest font section is dedicated to showing the KPIs value along with any unit information if required (ex. %, hrs, £).
KPI Tooltip – Information icon bottom right, will provide the user with a longer description of what this KPI is currently showing.
Double clicking on the value section of the KPI takes the user to the most appropriate report if available. Not all KPIs have a report that has sufficient data to reflect the value displayed on the KPI.
KPI Configuration pop-up
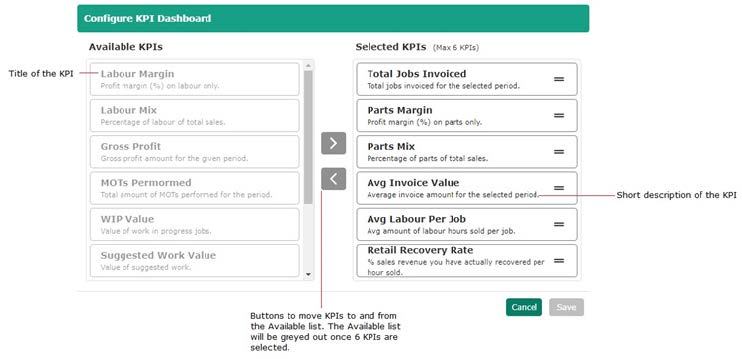
Click on the cog icon in the KPI Tile to customise each of the 6 KPI’s and the order in which to display on the screen.

Once pressed, the Configure KPI Dashboard pop up is displayed:

Additionally, any of the selected KPIs can be reordered by clicking and dragging them to the correct order. The pop-up also supports multi selection, meaning you can move multiple KPIs at a time to or from the selected KPI side.
List of available KPIs
| KPI | Short Description |
|---|---|
| Average Invoice Value | Average invoice amount for the selected period |
| Average Labour per Job | Average amount of labour hours sold per job |
| Average Invoice Profit | Average invoice profit for the selected period |
| Estimate Conversion | How many estimates end up with invoices shown as a percentage |
| Gross Profit | Gross profit amount for the given period |
| Labour Mix | Percentage of labour of total sales |
| Parts Mix | Percentage of parts of total sales |
| MOTs performed | Total amount of MOTs performed for the selected period |
| Labour Margin | Profit margin (%) on labour only |
| Parts Margin | Profit margin (%) on parts only |
| Recovered Work Value | Value of work deferred and then completed |
| Retail Recovery Rate | Percentage sales revenue recovered per hour sold |
| Suggested Work Value | Value of suggested work that has been added to jobs |
| Total Jobs Invoiced | Total number of jobs invoiced for the selected period |
| WIP Value | Value of work in progress jobs |
